Process mining is one of the methods for analyzing business processes and is a technique for mapping the flow of business operations using data that records the history of business operations. By analyzing the time and frequency of operations, it is possible to improve operations by reducing labor time and costs.
Get an idea of process mining
When it comes to visualizing processes from business data, you may ask yourself, “What kind of data do I put in?” “What information can we see?” “What type of work can process mining be used for?” First, let’s take a look at how processes can be visualized using data in any format. Below is a picture of the data used for process mining and the actual visualization.
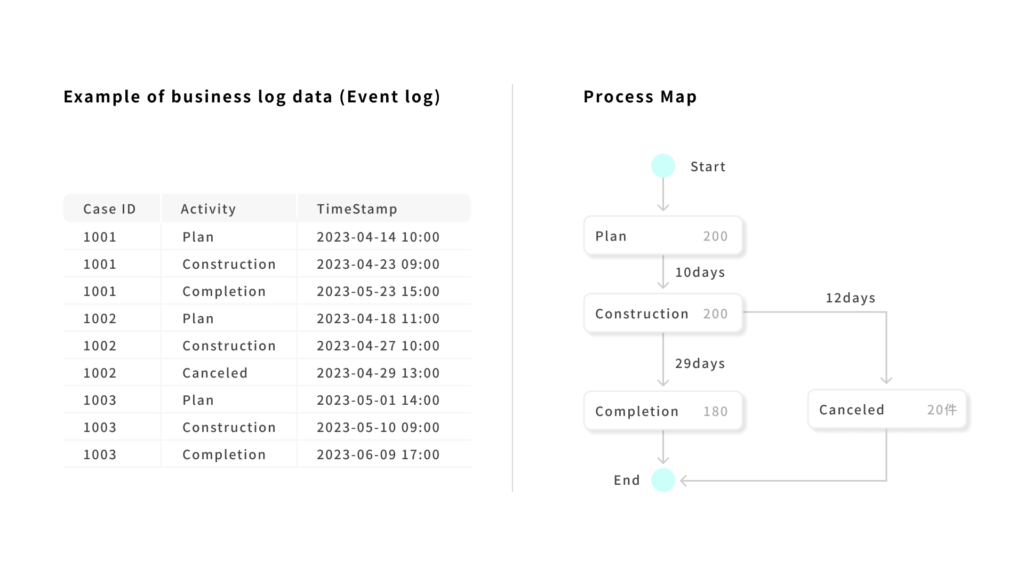
Log data that records business events is called an event log. In most cases, this event log is created by processing the business log data that a company already has.
Data that can be used for event logs
So what kind of data can be used for process mining? In fact, process data can be found anywhere in a company. For example, log data accumulated in a tool called “ERP” that manages internal operations such as finance and sales can be extracted and used to create an event log of a company’s purchasing operations. To learn more about ERP, visit the following Web site.
In other typical cases, data can be extracted from Google Analytics to analyze transition data of users visiting a web page as an event log, or extracted from a factory process control chart. The type of business varies by company and industry. Data that can be used for process mining should be found everywhere.
Information Needed for the Event Log
At least three types of data are required for the event log: case ID, activity, and timestamp.
Case ID : ID to link a series of operations
Activity : Description of the work performed
Timestamp: the time at which the operation started
Although there are process mining tools that can import additional attribute data such as responsible department, region, cost, etc., visualization of process diagrams is possible with the above three types of data (case ID, activity and timestamp). The most common data format is CSV, but there is also a format called XES dedicated to process mining. Which data extension is supported depends on the process mining tool.
Basic Functions of Process Mining
We will now introduce a basic feature of process mining called Variant Explorer.
A variant is a “process pattern”.
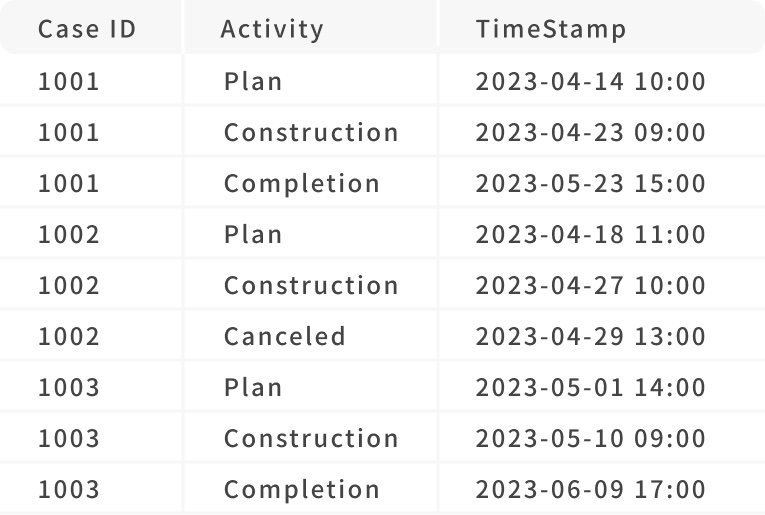
For example, if the following data is contained in the event log, cases 1001 and 1003 both have the transition pattern of design → construction → completion. This means that 1001 and 1003 are the same variant.
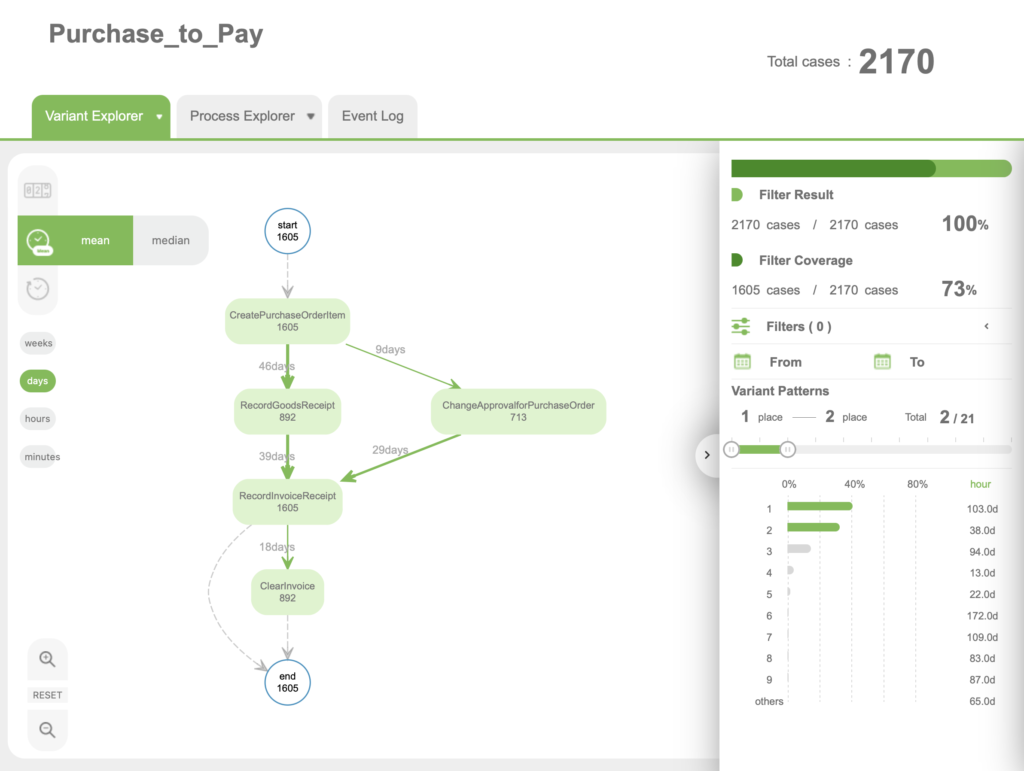
The Variant Explorer screen is shown below using demo data based on a picture of a company’s purchasing operations. The Variant Explorer is a feature for categorizing and analyzing processes by variant. By moving the slider in the lower right corner, you can change the number of variants to display. For example, this process diagram shows the variant with the highest number of cases and the variant with the second highest number of cases. Also, the graph in the lower right of the screen shows that most cases are concentrated in the variant with the highest number of cases, which makes up a large percentage of the total number of cases. Using this feature, Variant Explorer can also be used to evaluate whether business processes are standardized.
This process mining tool uses “Minpro”, a free process mining tool distributed by the Process Mining Association of Japan. For more information about Minpro, click below.
Using Process Mining
There are three staged uses for process mining
Discovery: Visualize the process
Conformance: Evaluate the adequacy of the process
Improvement: Improve the process
Discovery
Using Minpro as an example, the second most common variant includes an activity called “Delete Payment Block”. This means that a payment block has occurred. The occurrence of a payment block indicates that there is a delay in payment. In this way, the key to discovery is to visualize the process diagram with data to understand “How our business processes are.” For example, by narrowing down the processes where payment blocks occur, you can analyze the characteristics of the processes that are prone to payment blocks This can be done using the “Filter” function. Discovery is the process of using process diagrams to review the facts of business operations and discover problems in business processes by narrowing the conditions. This is the most basic analysis method using process diagrams that is characteristic of process mining.
Conformance
The terms As Is and To Be are often used in process mining discussions: As is refers to the current state and To be refers to the ideal state. Conformance refers to the analysis based on what percentage of the process deviates from the ideal state and the current state. There are various ways to define To be, the type of activities that should occur, the ideal order, and the time it takes to complete the process are often used as indicators. Some process mining tools have a conformance feature that allows you to define your ideal process. From the event log, they can calculate and display what percentage of the current state matches the ideal, alert you to what specific unexpected activities are occurring, and so on.
Enhancement
Data analysis is not just about visualization. It is necessary to identify the root causes of problems based on the visualization results and make continuous improvements. Enhancement is to create a mechanism to deal with each process problem accordingly. For example, suppose you know from the data you have already analyzed that there is a process that causes a payment block because the flow of approvals to payment is incorrect. In this case, the improvement would be to create a mechanism that alerts us when we know that a similar problem is occurring during the real-time analysis of the current process.
Areas where process mining comes into play
While there are probably processes lurking everywhere that can be analyzed, here are some typical areas where process mining is often used.
Purchasing
Purchasing, which has been mentioned several times in this article, is a typical area for process mining. Since purchase orders are a part of every company’s operations, process mining is often used because it is familiar to many companies and data can be easily obtained from ERP systems and other sources. In addition, process mining is a technology that originated in Germany and has spread throughout Europe, and there is a culture in the surrounding countries of offering discounts if payments are made on time. Another reason for using process mining in this area is that the ease of making payments on time is directly related to profits.
Manufacturing
In manufacturing, it is important to improve the rate of defective products and overall factory productivity. In many cases, data exists that records the manufacturing process, making it an area where it is easy to get a starting point for analysis. By using process mining to visualize the root causes of defects and bottlenecks, it is possible to improve the production system.
Financial Industry
In the financial industry, process mining is often used for fraud detection. By visualizing processes using transaction process data, it is easier to detect fraudulent withdrawals, etc. This works well with process mining tools with compliance checking capabilities to efficiently find suspicious transactions.
Other
Process mining is used in many other areas. For example, in system maintenance, process mining can be used to optimize the work process from the time an error occurs to the time a correction is reflected, in web marketing to analyze customer purchase paths, in customer service to reduce customer wait times for a user experience factory, and in any other area.
Summary
Process Mining is a technology that enables the visualization of business operations through data, allowing analysis while digging deeper into the process. It is characterized by the use of process diagrams that show the flow and time of business operations, and allows analysis that is not possible with general data analysis tools such as BI tools. And in the past, visualizing such business processes was very difficult. In fact, to visualize business processes, it was done by gathering all the managers in the field and interviewing them about the details of their work, while visualizing the flow of work using post-its. In contrast, the strengths of process mining are that it does not require such interviews and that it provides highly reliable results that are visualized based on the facts of the data. By using process mining, we can get a bird’s eye view of the organization and review operations from a fundamental level. We hope you find this article useful in understanding process mining and helping you improve your future operations.